
Nevada County Housing Market Update: November 2026 (October Data for Buyers and Sellers)
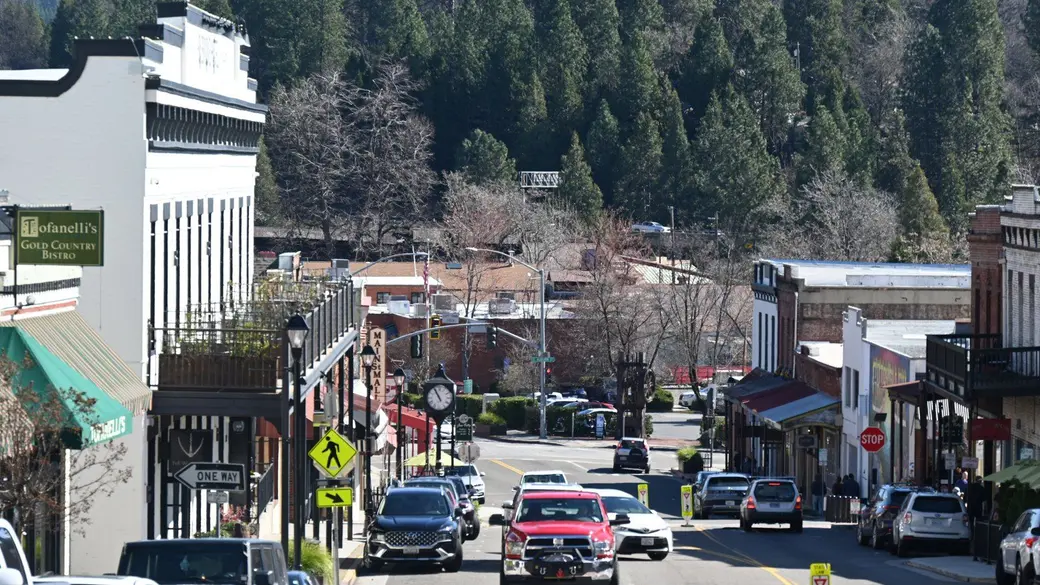
If you are thinking about buying or selling in Grass Valley, Nevada City or Penn Valley this winter, the newest numbers are in. Realtor.com’s October 2026 data for Nevada County shows a market that is steady on price, a little lighter on inventory than a year ago, and moving faster than last fall.
Below I break down what changed, how this October compares with past years, and what it means for you. If you want the earlier snapshot, see my October 2026 Nevada County market update.
Key Takeaways: Nevada County Housing Market, November 2026
- Prices are flat: the median listing price was $662,023 in October 2026, unchanged from September and 1.0% below October 2025 ($668,625), per Realtor.com.
- Fewer homes for sale: 533 active listings, down 6.8% from 572 a year earlier.
- Homes are selling faster than last fall: median days on market was 71, compared with 85 in October 2025.
- Pending sales slowed: 153 listings were pending, down from 203 a year ago, while about 19.5% of listings had a price cut.
- Rates are still high: Freddie Mac’s 30-year fixed average was 7.18% as of November 5, 2026.
What Do the Latest Nevada County Housing Numbers Show?
Realtor.com publishes monthly listing data for every U.S. county. For Nevada County, October 2026 looked like a calm, balanced fall market. The median listing price held at $662,023, and the median listing price per square foot was $344, up from $333 a year earlier.
Keep in mind these are listing figures, not closed sales. They show what sellers are asking and how fast homes go under contract, which is a good early read on where the market is heading.
| Measure | October 2026 | September 2026 | October 2025 | Change vs. last year |
|---|---|---|---|---|
| Median listing price | $662,023 | $662,023 | $668,625 | down 1.0% |
| Active listings | 533 | 560 | 572 | down 6.8% |
| New listings | 144 | 176 | 134 | up 7.5% |
| Pending listings | 153 | 164 | 203 | down 24.6% |
| Median days on market | 71 | 67 | 85 | -14 days |
| Share of listings with a price cut | 19.5% | 20.7% | 19.3% | +0.2 points |
| Median price per square foot | $344 | $352 | $333 | up 3.3% |
Are Home Prices Going Down in Nevada County?
Not in any meaningful way. The median listing price is 1.0% lower than last October, which is close to flat. Zillow’s Home Value Index, which estimates the typical value of all homes (not only homes on the market), was about $610,265 in September 2026, up 0.8% from $605,490 in September 2025.
Put simply, values have held steady over the past year. Individual homes still vary a lot by location, condition, acreage and town.
How Does This October Compare With Past Years?
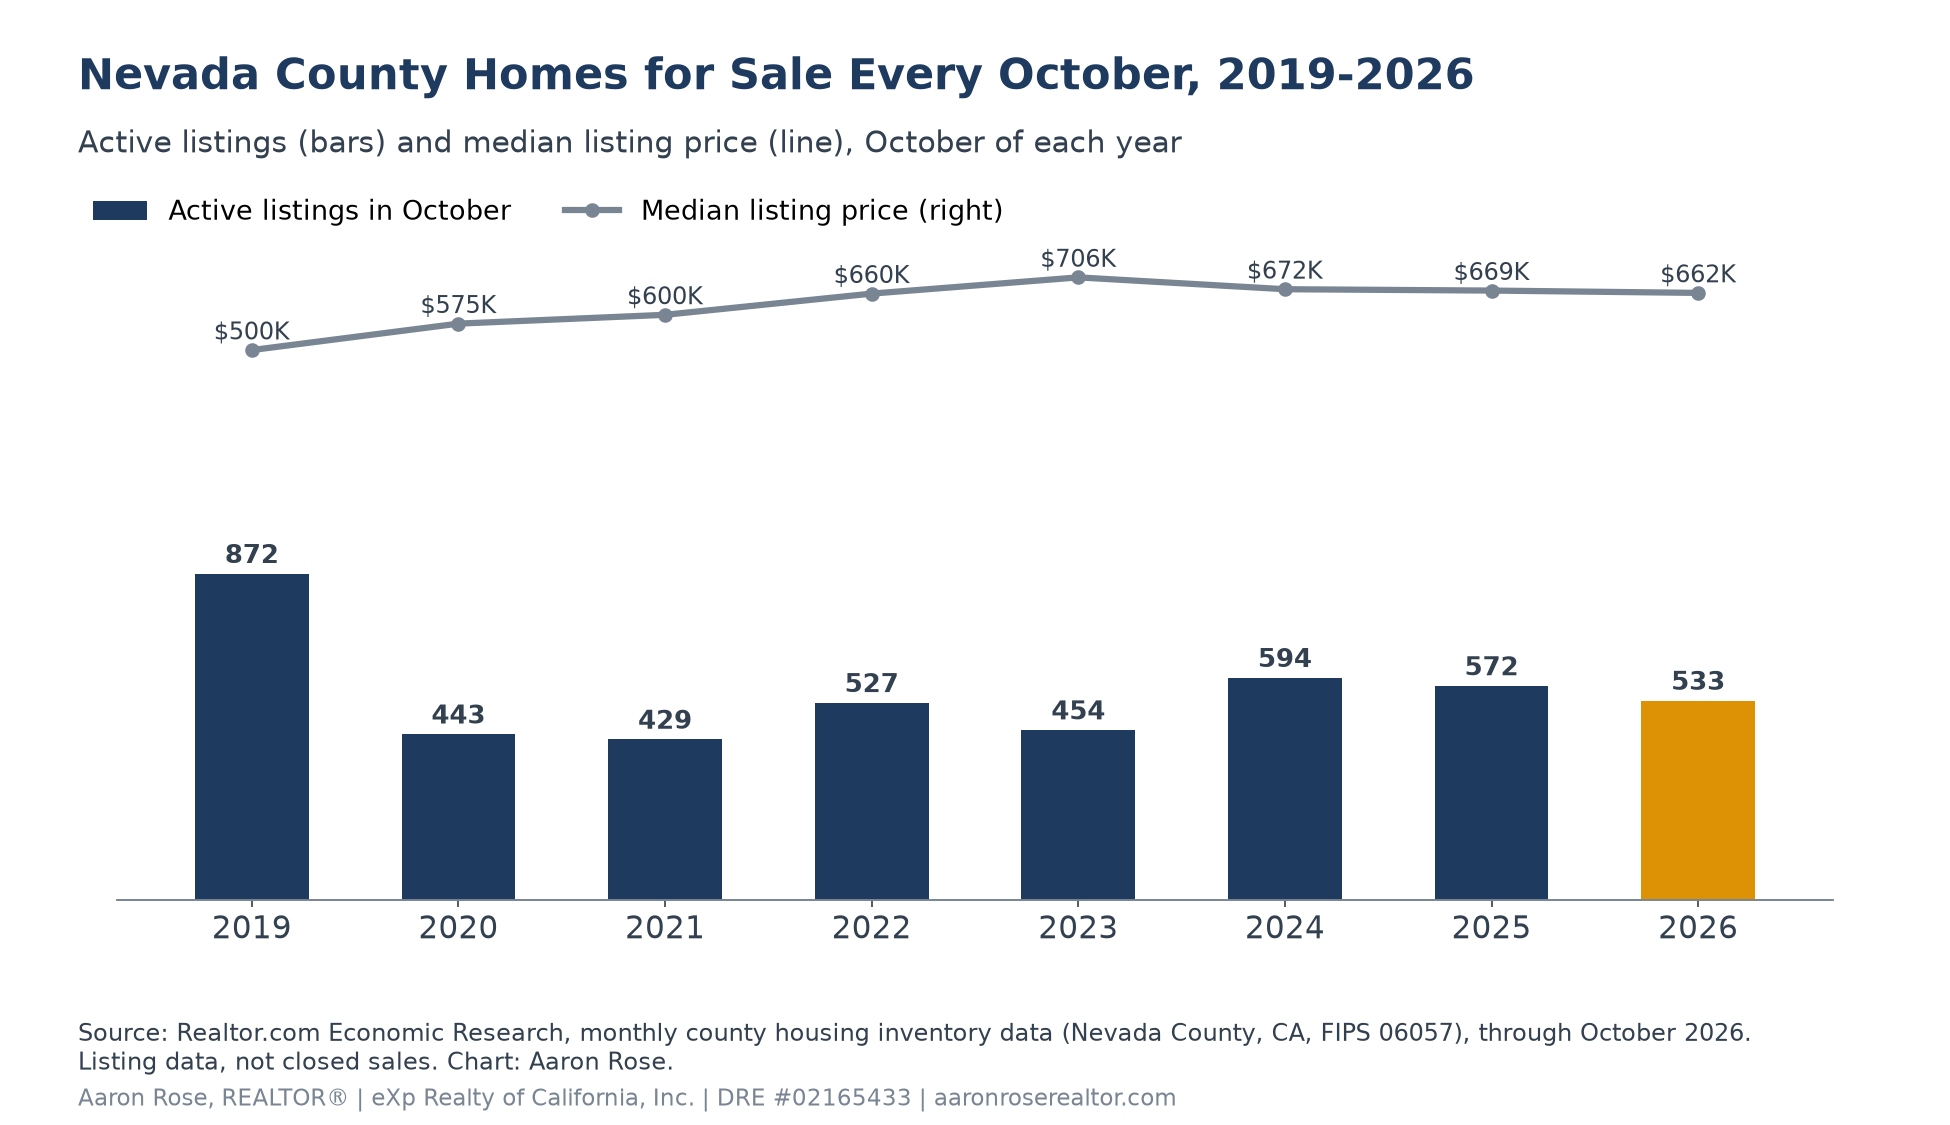
Looking at October alone takes seasonality out of the picture. This year’s 533 active listings is below 2024 and 2025, but well above the very tight Octobers of 2020 and 2021, when fewer than 450 homes were for sale. The median listing price peaked in October 2023 at $706,000 and has eased slightly since.
| October | Active listings | Median listing price | Median days on market |
|---|---|---|---|
| 2019 | 872 | $500,000 | 87 |
| 2020 | 443 | $574,900 | 48 |
| 2021 | 429 | $599,900 | 43 |
| 2022 | 527 | $660,000 | 65 |
| 2023 | 454 | $706,000 | 63 |
| 2024 | 594 | $672,450 | 69 |
| 2025 | 572 | $668,625 | 85 |
| 2026 | 533 | $662,023 | 71 |
What Happens to the Market in Winter?
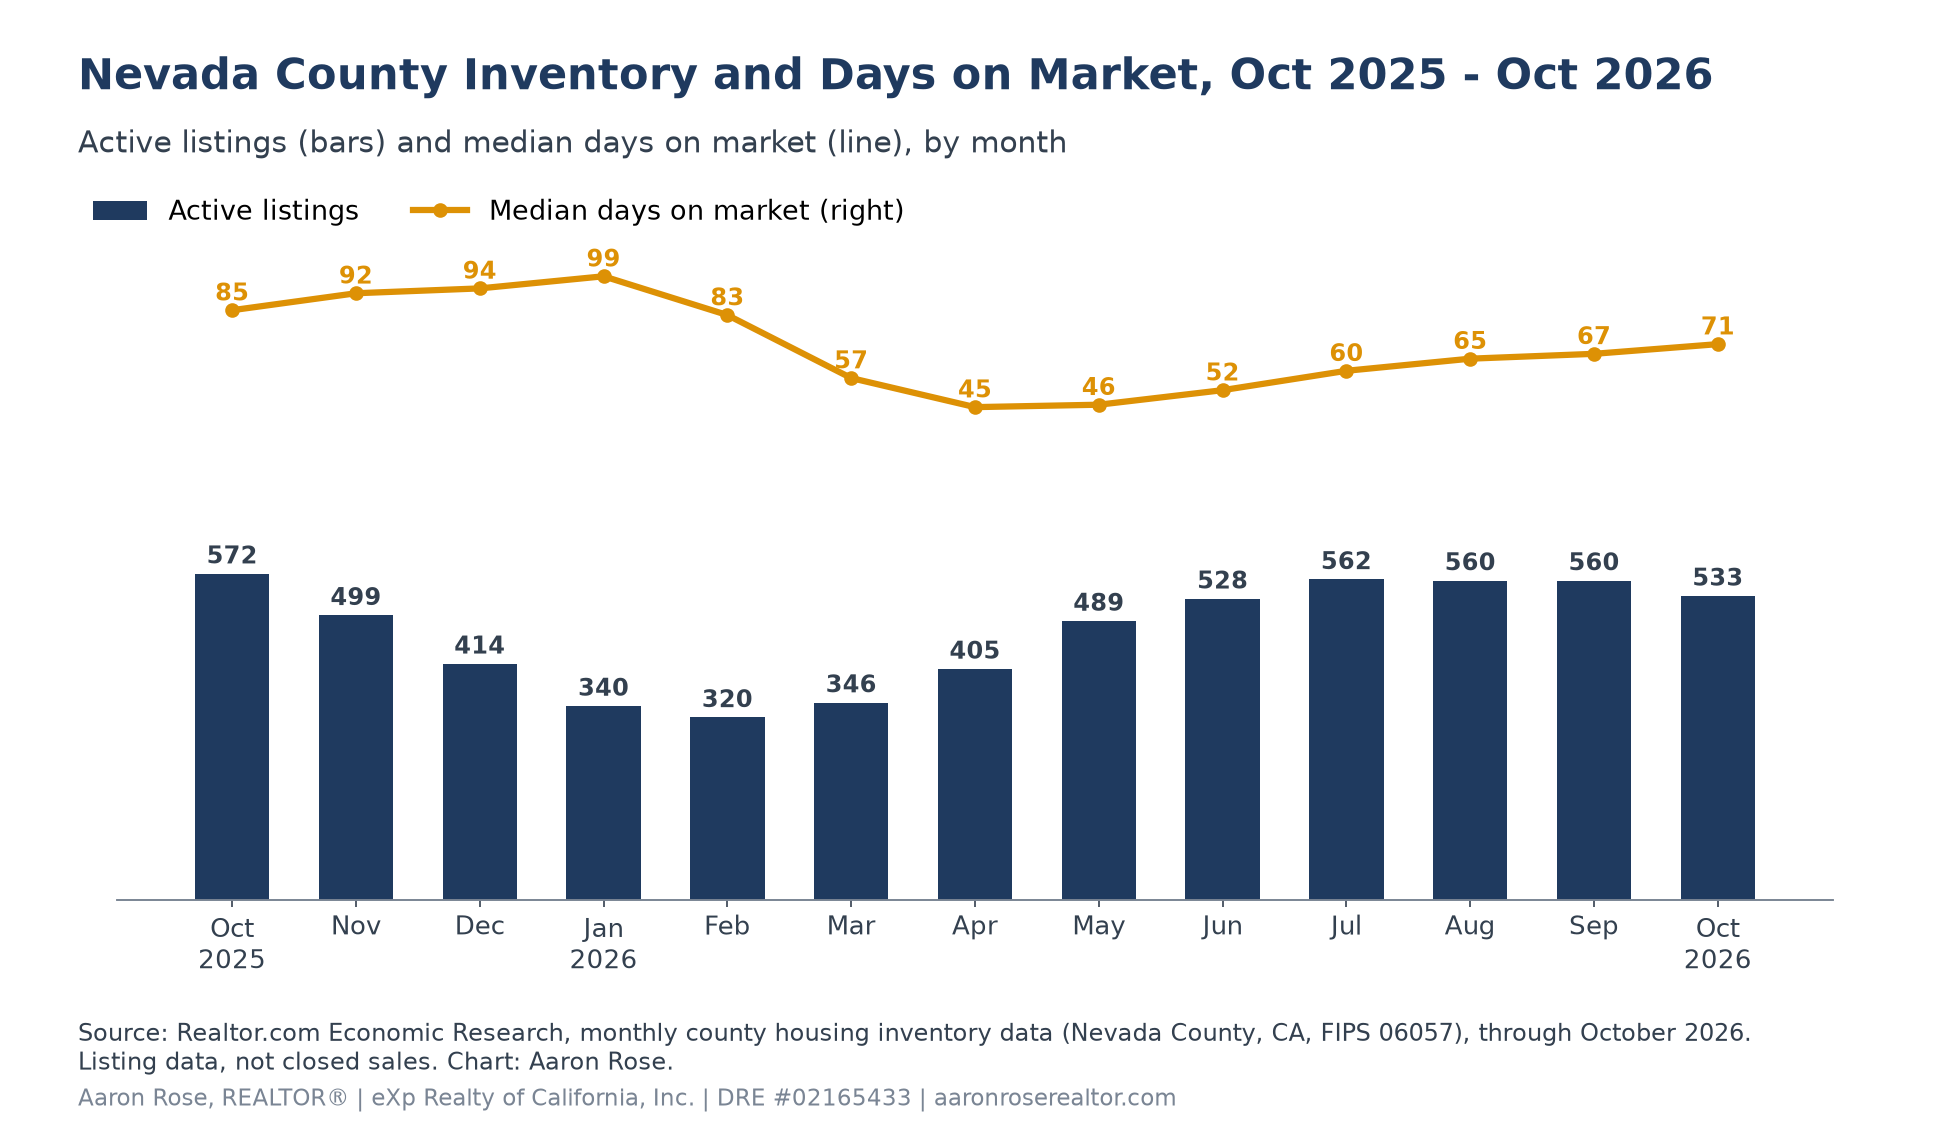
If last year is a guide, expect fewer homes for sale over the next few months. Active listings fell from 572 in October 2025 to a low of 320 in February 2026, and median days on market peaked at 99 in January 2026. Then spring brought new listings and faster sales.
| Month | Active listings | New listings | Pending listings | Median days on market |
|---|---|---|---|---|
| 2025-10 | 572 | 134 | 203 | 85 |
| 2025-11 | 499 | 120 | 174 | 92 |
| 2025-12 | 414 | 84 | 130 | 94 |
| 2026-01 | 340 | 116 | 113 | 99 |
| 2026-02 | 320 | 136 | 140 | 83 |
| 2026-03 | 346 | 214 | 155 | 57 |
| 2026-04 | 405 | 242 | 170 | 45 |
| 2026-05 | 489 | 244 | 177 | 46 |
| 2026-06 | 528 | 202 | 199 | 52 |
| 2026-07 | 562 | 212 | 181 | 60 |
| 2026-08 | 560 | 200 | 179 | 65 |
| 2026-09 | 560 | 176 | 164 | 67 |
| 2026-10 | 533 | 144 | 153 | 71 |
For a deeper look at buying this time of year, including snow and storm checks, read my guide to buying a home in Nevada County in winter.
What This Means If You Want to Buy
Winter can be a good window, with less competition.
- Expect fewer choices but more room to negotiate. About 19% of listings had a price cut in October, and pending sales are down from last year.
- Know your payment. As an illustrative estimate only, a $662,023 home with 20% down at 7.18% would carry about $3,588 a month in principal and interest, before taxes and insurance.
- Check the property basics: wells, septic and roads matter in rural areas. My well and septic guide covers what to inspect.
- Start your search: browse homes for sale and get pre-approved before the spring rush.
How Does Nevada County Compare With Nearby Counties?
Nevada County sits between pricier Placer County and the more affordable valley counties. Here is how October 2026 compared across the region, using the same Realtor.com data.
| County | Median listing price | Active listings | Median days on market | Share with a price cut |
|---|---|---|---|---|
| Nevada County | $662,023 | 533 | 71 | 19.5% |
| Placer County | $730,428 | 1395 | 58 | 20.6% |
| Sutter County | $479,000 | 196 | 57 | 23.7% |
| Yuba County | $440,000 | 274 | 71 | 18.4% |
If you are relocating, my Moving to Nevada County guide compares towns, commutes and costs, including Lake Wildwood and Penn Valley.
What This Means If You Want to Sell
Pricing right matters more when buyers have time to compare.
- Price to the market from day one. With homes taking a median of 71 days and about one in five listings cutting price, an accurate starting price helps avoid a long stay on the market.
- Listing in winter can work. Fewer competing listings means your home can stand out to serious buyers.
- Plan ahead for inspections and disclosures. My guide to selling in Nevada County walks through what buyers will ask for.
- Want to know your number? Request a free home value estimate or see nearby sold homes.
FAQ: Nevada County Housing Market, November 2026
What is the median home price in Nevada County right now?
The median listing price was $662,023 in October 2026. That figure comes from Realtor.com and reflects asking prices, not closed sales. Zillow’s typical home value estimate was about $610,265 in September 2026.
Are home prices going down in Nevada County?
Prices are roughly flat. The October 2026 median listing price was 1.0% below October 2025, and Zillow’s home value index was up 0.8% year over year in September 2026.
How many homes are for sale in Nevada County?
There were 533 active listings in October 2026. That is down 6.8% from 572 in October 2025, according to Realtor.com.
How long does it take to sell a home in Nevada County?
The median was 71 days on market in October 2026. That is faster than the 85 days recorded in October 2025, though winter months have run longer, peaking at 99 days in January 2026.
Is Nevada County a buyer’s or seller’s market?
It is fairly balanced. Prices are steady and homes are selling faster than last year, but pending sales are down and about 19.5% of listings had a price cut in October 2026.
Is winter a good time to buy in Nevada County?
It can be. Last winter, active listings fell to 320 by February 2026, so there are fewer choices, but buyers often face less competition and more motivated sellers.
What are mortgage rates right now?
Freddie Mac’s 30-year fixed average was 7.18% as of November 5, 2026. That is a national weekly average; your own rate depends on your credit, loan type and down payment.
Sources
- Realtor.com Economic Research: monthly county housing inventory data (Nevada, Placer, Sutter and Yuba counties), October 2026
- Zillow Research: Zillow Home Value Index (ZHVI) by county, September 2026
- Freddie Mac Primary Mortgage Market Survey: 30-year fixed average 7.18% as of November 5, 2026
- Featured photo: “View of Grass Valley, CA 2025” by AstroDominant, CC BY 4.0, cropped, via Wikimedia Commons.
Last updated November 11, 2026 by Aaron Rose, REALTOR®, DRE #02165433, eXp Realty of California, Inc. (broker DRE #01878277). Equal Housing Opportunity. This article is general information, not legal, lending or financial advice. Listing data reflects asking prices and can be revised; the payment example is an illustrative estimate, not a loan offer.
Ready to talk through your next step?
Whether you are buying or selling in Nevada County this winter, let’s look at what these numbers mean for your home and your plans.
Recent Posts





GET MORE INFORMATION

Agent License ID: 02165433