
Yuba City Housing Market Update: November 2026 (October Data for Buyers and Sellers)
Thinking about buying or selling in Yuba City this winter? The October 2026 numbers are in, and Yuba City is telling a slightly different story than the rest of the region. There are more homes for sale than a year ago, but more homes are also going under contract, and asking prices are holding steady.
Below I break down what changed since last October in Yuba City’s two ZIP codes, how this fall compares with every October since 2019, what last winter looked like, and what it all means for your plans. (For the bigger picture across the river, see my Yuba County November 2026 market update.)
Key Takeaways: Yuba City Housing Market, November 2026
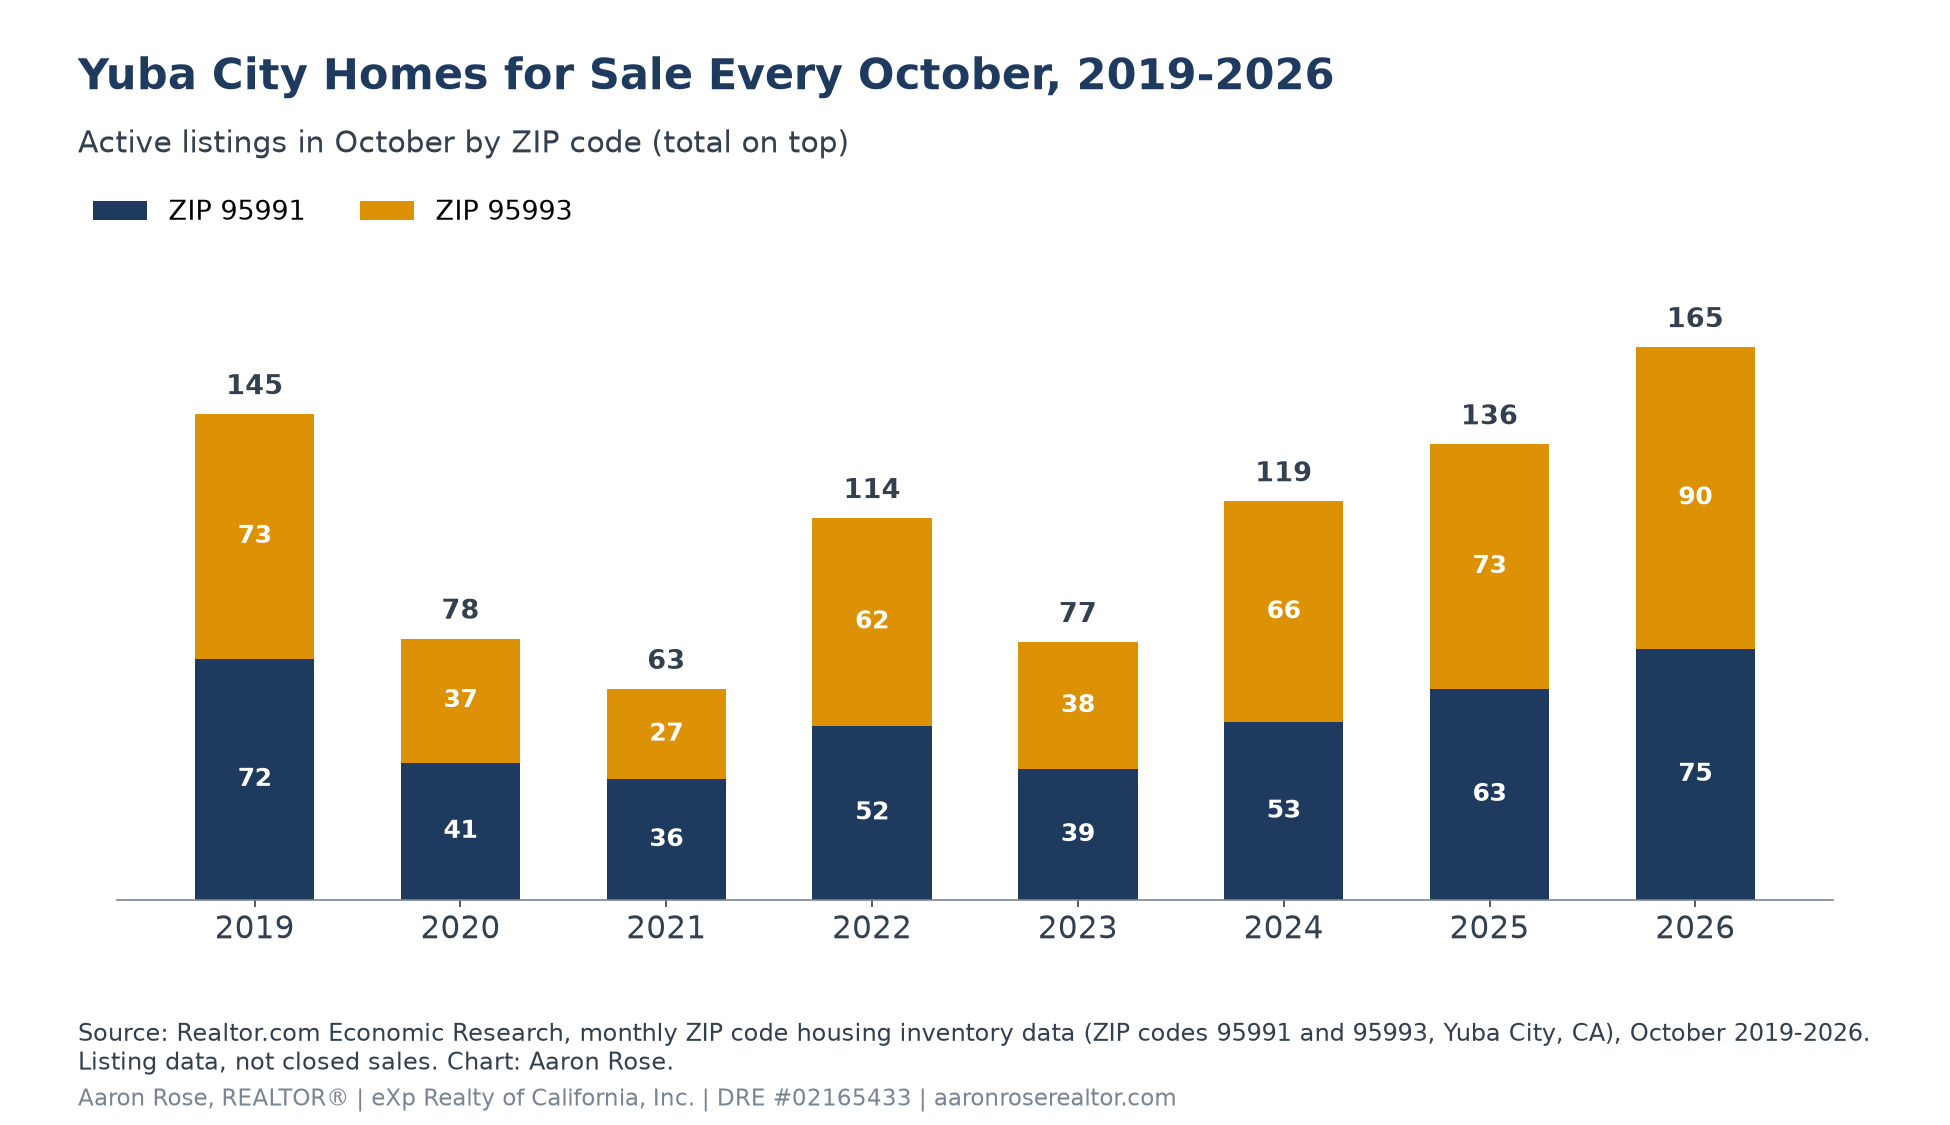
- More choices: Yuba City ZIP codes 95991 and 95993 had 165 active listings in October 2026, up 21% from 136 a year earlier and the most for any October since at least 2019, per Realtor.com.
- More homes went under contract: 74 listings were pending in the two ZIP codes, up from 52 in October 2025.
- Asking prices held steady: the median listing price was $413,000 in ZIP 95991 (up 0.4% from a year ago) and $542,790 in ZIP 95993 (up 3.0%).
- A bit slower: median days on market was 58 in 95991 and 59 in 95993, versus 52 and 56 last October.
- Rates eased slightly: Freddie Mac’s 30-year fixed average was 7.11% as of November 12, 2026, down from 7.18% the week before.
What Did Yuba City’s Housing Market Do in October 2026?
Realtor.com publishes monthly listing data by ZIP code. Yuba City is covered by two main ZIP codes, 95991 and 95993, so I look at both side by side. These are listing figures, not closed sales. They show what sellers are asking and how quickly homes go under contract, which is an early read on where prices are heading.
The headline: inventory grew, but buyers kept pace better than in many nearby areas. Pending listings in ZIP 95991 doubled from 17 to 34, and ZIP 95993 rose from 35 to 40. At the same time, more sellers trimmed prices in 95993, where about 27% of listings had a price cut, up from 20% a year ago.
| Measure | 95991: Oct 2026 | 95991: Oct 2025 | 95993: Oct 2026 | 95993: Oct 2025 |
|---|---|---|---|---|
| Median listing price | $413,000 | $411,200 | $542,790 | $527,225 |
| Active listings | 75 | 63 | 90 | 73 |
| New listings | 28 | 24 | 32 | 36 |
| Pending listings | 34 | 17 | 40 | 35 |
| Median days on market | 58 | 52 | 59 | 56 |
| Share of listings with a price cut | 23.4% | 23.6% | 27.3% | 20.3% |
| Median price per square foot | $265 | $257 | $272 | $264 |
| Median home size (sq. ft.) | 1,568 | 1,500 | 1,943 | 2,029 |
Are Home Prices Dropping in Yuba City?
Not by these numbers. Asking prices in both Yuba City ZIP codes were slightly higher than last October: up 0.4% in 95991 and up 3.0% in 95993. That is a contrast with Yuba County across the river, where the October median listing price was down about 6% year over year, and with the wider Yuba City metro area (Sutter and Yuba counties combined), where it slipped 3.2% to $455,500.
Prices per square foot were roughly flat, so the bigger change this fall is more homes to choose from and more room to negotiate on some listings, not falling values. The condition, location and size of any one home still matter most.
How Does This October Compare With Past Years?
Comparing October to October removes the seasonal swings. This year’s 165 active listings across the two ZIP codes is the highest October count in Realtor.com’s ZIP data going back to 2019, and more than double the 63 homes for sale in October 2021, when the market was at its tightest.
| October | Active listings, 95991 | Active listings, 95993 | Total | Median listing price, 95991 | Median listing price, 95993 |
|---|---|---|---|---|---|
| 2019 | 72 | 73 | 145 | $315,564 | $367,000 |
| 2020 | 41 | 37 | 78 | $345,000 | $482,900 |
| 2021 | 36 | 27 | 63 | $350,000 | $489,900 |
| 2022* | 52 | 62 | 114 | $439,000 | $478,000 |
| 2023 | 39 | 38 | 77 | $432,225 | $532,500 |
| 2024 | 53 | 66 | 119 | $432,450 | $509,925 |
| 2025 | 63 | 73 | 136 | $411,200 | $527,225 |
| 2026 | 75 | 90 | 165 | $413,000 | $542,790 |
*Realtor.com flagged its October 2022 figures for both ZIP codes as less reliable, so treat that row with caution.
Asking prices tell a steadier story. ZIP 95991’s October median has stayed between $411,200 and $432,450 since 2023, while 95993, which tends to have larger homes, is at its highest October level in this data.
How Does Yuba City Compare With Sutter County and Nearby Areas?
Most of Sutter County’s homes for sale are in Yuba City, so the county numbers move in step. In October 2026 Sutter County had 196 active listings, up 22% from 161, with a median listing price of $479,000 and 57 median days on market. Pending listings rose to 89 from 67.
| Area | Median listing price | Active listings | Median days on market | Share with a price cut |
|---|---|---|---|---|
| Yuba City ZIP 95991 | $413,000 | 75 | 58 | 23.4% |
| Yuba City ZIP 95993 | $542,790 | 90 | 59 | 27.3% |
| Yuba City metro (Sutter + Yuba counties) | $455,500 | 471 | 64 | 21.6% |
| Sutter County | $479,000 | 196 | 57 | 23.7% |
| Yuba County | $440,000 | 274 | 71 | 18.4% |
| Nevada County | $662,023 | 533 | 71 | 19.5% |
| Placer County | $730,428 | 1,395 | 58 | 20.6% |
Yuba City homes are selling faster than Yuba County’s overall median of 71 days, and they still list for far less than Placer or Nevada County. If you are deciding between the two sides of the river, my Yuba City vs. Marysville comparison walks through the trade-offs, and my guide to Yuba City flood zones and flood insurance covers a cost many buyers overlook.
What Usually Happens to the Market in Winter?
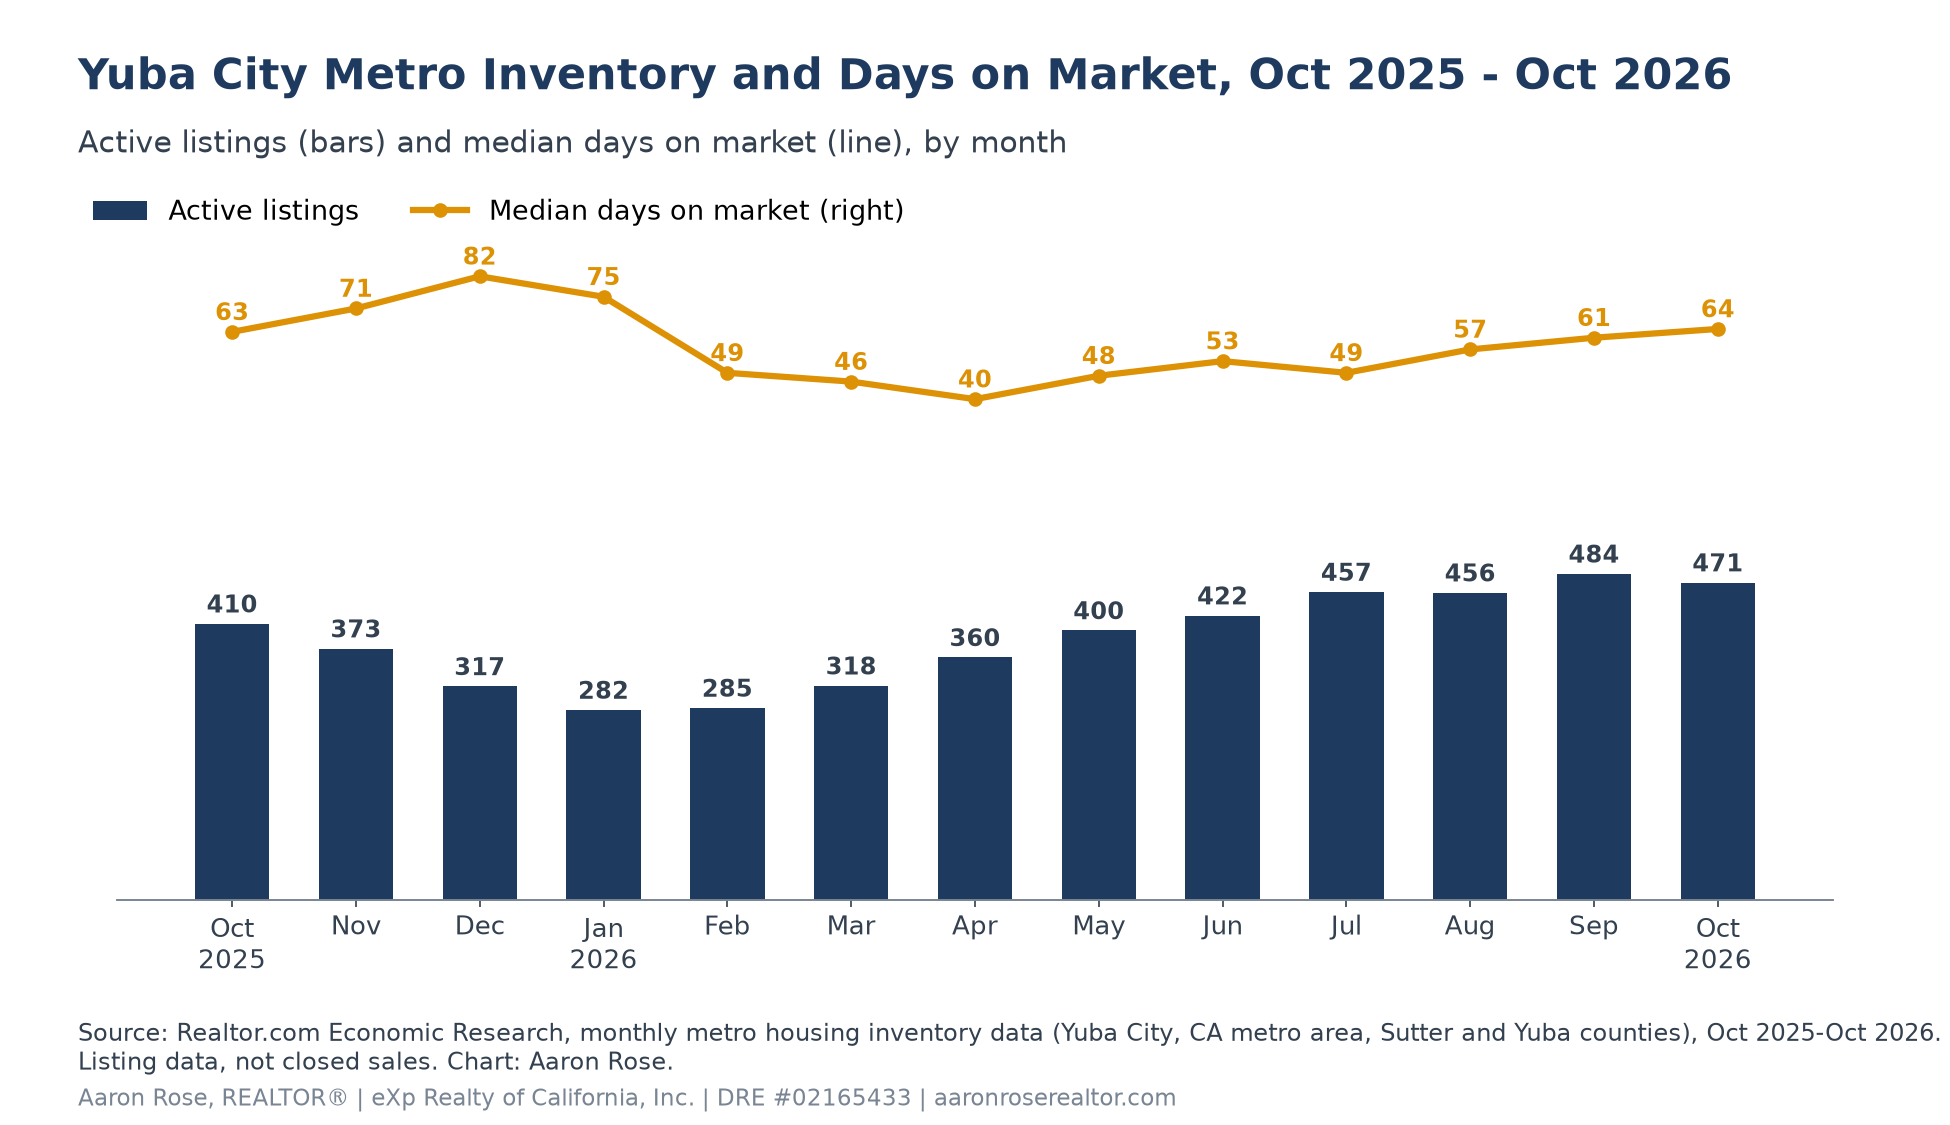
Last winter is a useful guide. Across the Yuba City metro area, active listings fell from 410 in October 2025 to a low of 282 in January 2026, and median days on market peaked at 82 in December 2025. New listings then picked up in February and March, and homes sold fastest in April.
| Month | Active listings | New listings | Pending listings | Median days on market |
|---|---|---|---|---|
| October 2025 | 410 | 154 | 170 | 63 |
| November 2025 | 373 | 100 | 161 | 71 |
| December 2025 | 317 | 108 | 120 | 82 |
| January 2026 | 282 | 132 | 110 | 75 |
| February 2026 | 285 | 162 | 158 | 49 |
| March 2026 | 318 | 198 | 169 | 46 |
| April 2026 | 360 | 194 | 203 | 40 |
| May 2026 | 400 | 216 | 217 | 48 |
| June 2026 | 422 | 196 | 223 | 53 |
| July 2026 | 457 | 200 | 198 | 49 |
| August 2026 | 456 | 164 | 196 | 57 |
| September 2026 | 484 | 168 | 159 | 61 |
| October 2026 | 471 | 140 | 165 | 64 |
This year the metro area starts winter with 471 active listings, 15% more than last October, so buyers should still have more to choose from than they did last winter even as listings thin out.
What This Means If You Want to Buy
You have more homes to choose from than a year ago, but the good ones are still getting picked up.
- Use the extra inventory. With 165 homes for sale in Yuba City’s two ZIP codes, you can compare more options and ask for repairs or closing-cost help on homes that have sat.
- Move quickly on the right home. Pending sales were up from last year, so well-priced homes are not lingering.
- Know your payment. As an illustrative estimate only, a $479,000 home (Sutter County’s October median listing price) with 20% down at 7.11% would carry about $2,578 a month in principal and interest, before taxes and insurance.
- Still renting? My rent vs. buy guide for Yuba City helps you compare, and you can browse homes for sale anytime.
What This Means If You Want to Sell
Buyers are active, but they have more choices, so pricing and presentation matter.
- Price it right from day one. About 27% of listings in ZIP 95993 and 23% in 95991 had a price cut in October. An accurate starting price helps you avoid chasing the market.
- Compare against your ZIP code. 95991 and 95993 have very different price points, so county-wide averages can mislead.
- Winter can work. My guide to selling in Yuba City over the holidays and breakdown of what it costs to sell can help you plan. If your home did not sell this fall, see why a Yuba City home may not have sold.
- Want to know your number? Request a free home value estimate or see nearby sold homes.
FAQ: Yuba City Housing Market, November 2026
What is the median home price in Yuba City right now?
The median listing price was $413,000 in ZIP 95991 and $542,790 in ZIP 95993 in October 2026. Those are Realtor.com asking prices, not closed sales. Sutter County’s median listing price was $479,000.
Are home prices going down in Yuba City?
No, asking prices were steady to slightly higher. The October 2026 median listing price was up 0.4% from a year earlier in ZIP 95991 and up 3.0% in ZIP 95993, according to Realtor.com.
How many homes are for sale in Yuba City?
There were 165 active listings in ZIP codes 95991 and 95993 in October 2026. That is up from 136 in October 2025 and the most for any October since at least 2019.
How long does it take to sell a home in Yuba City?
The median was 58 days in ZIP 95991 and 59 days in ZIP 95993 in October 2026. Last winter the Yuba City metro median peaked at 82 days in December 2025.
Is Yuba City a buyer’s or seller’s market?
It is fairly balanced. Inventory is up from last year, which helps buyers, but pending sales also rose to 74 from 52 and asking prices held steady, which supports sellers.
How does Yuba City compare with Yuba County?
Yuba City is holding up better on price and speed. Yuba County’s October median listing price was $440,000, down from a year ago, with 71 median days on market.
What are mortgage rates right now?
Freddie Mac’s 30-year fixed average was 7.11% as of November 12, 2026. That is a national weekly average; your own rate depends on your credit, loan type and down payment.
Want the month-by-month details from earlier this fall? See my October 2026 Yuba City market update, or read my Moving to Yuba City guide if you are relocating.
Sources
- Realtor.com Economic Research: monthly ZIP code, county and metro housing inventory data (ZIP codes 95991 and 95993; Sutter, Yuba, Nevada and Placer counties; Yuba City, CA metro area), October 2026
- Freddie Mac Primary Mortgage Market Survey: 30-year fixed average 7.11% as of November 12, 2026
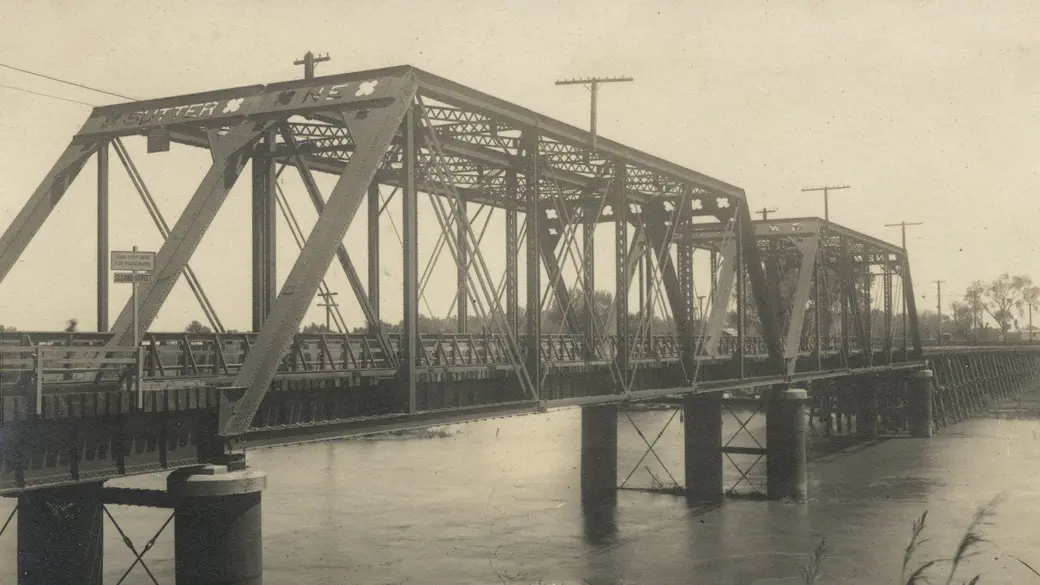
- Featured photo: North East Bridge across the Feather River, Yuba City, early 1900s postcard, author unknown, public domain (published before 1931), cropped, via Wikimedia Commons.
Last updated November 13, 2026 by Aaron Rose, REALTOR®, DRE #02165433, eXp Realty of California, Inc. (broker DRE #01878277). Equal Housing Opportunity. This article is general information, not legal, lending or financial advice. Listing data reflects asking prices and can be revised; the payment example is an illustrative estimate, not a loan offer.
Ready to talk through your next step?
Whether you are buying or selling in Yuba City this winter, let’s look at what these numbers mean for your home and your plans.
Recent Posts






GET MORE INFORMATION

Agent License ID: 02165433